I was recently tasked with coming up with a solution that enabled several different types of information related to Azure VMs to be collected and reported on. Types of information included application logs, operating system logs and Azure activity logs. Readers of this blog may not know that Azure has a product called Log Analytics that is similar to Splunk (except for the cost) that can capture and report on just about any kind of logs you can imagine. In this post we’ll take a look at what goes into getting syslog information into Log Analytics and then running some basic queries against those logs.
Problem
How can an Azure user collect syslog information in a central repository like Log Analytics and write reports and/or get notified of certain operating system events as they occur?
Solution
What is Log Analytics
First, let’s look at what LogAnalytics is and the basics of how we can report from it. Log Analytics is a service that helps you collect and report against data generated by resources in Azure or from your on-premises environment. It is a very powerful SaaS offering from Microsoft that can hold and analyze millions of records using the Kusto query language. It has a very flexible reporting web-based environment as well as a full REST API for integration with other tools. An additional benefit of using Log Analytics is that you can setup monitoring on your data to alert you when certain log criteria are met which we’ll cover in more detail later.
Create Log Analytics Workspace
The first step in getting useful information from Log Analytics is to create a Log Analytics workspace in your subscription if you don’t already have one. This can be done using a recent version (2.0.80+) of the Azure CLI with…
az monitor log-analytics workspace create \ ✔ 10111 14:19:26
--resource-group example-rg \
--workspace-name azurevmlogs \
--location usgovvirginia
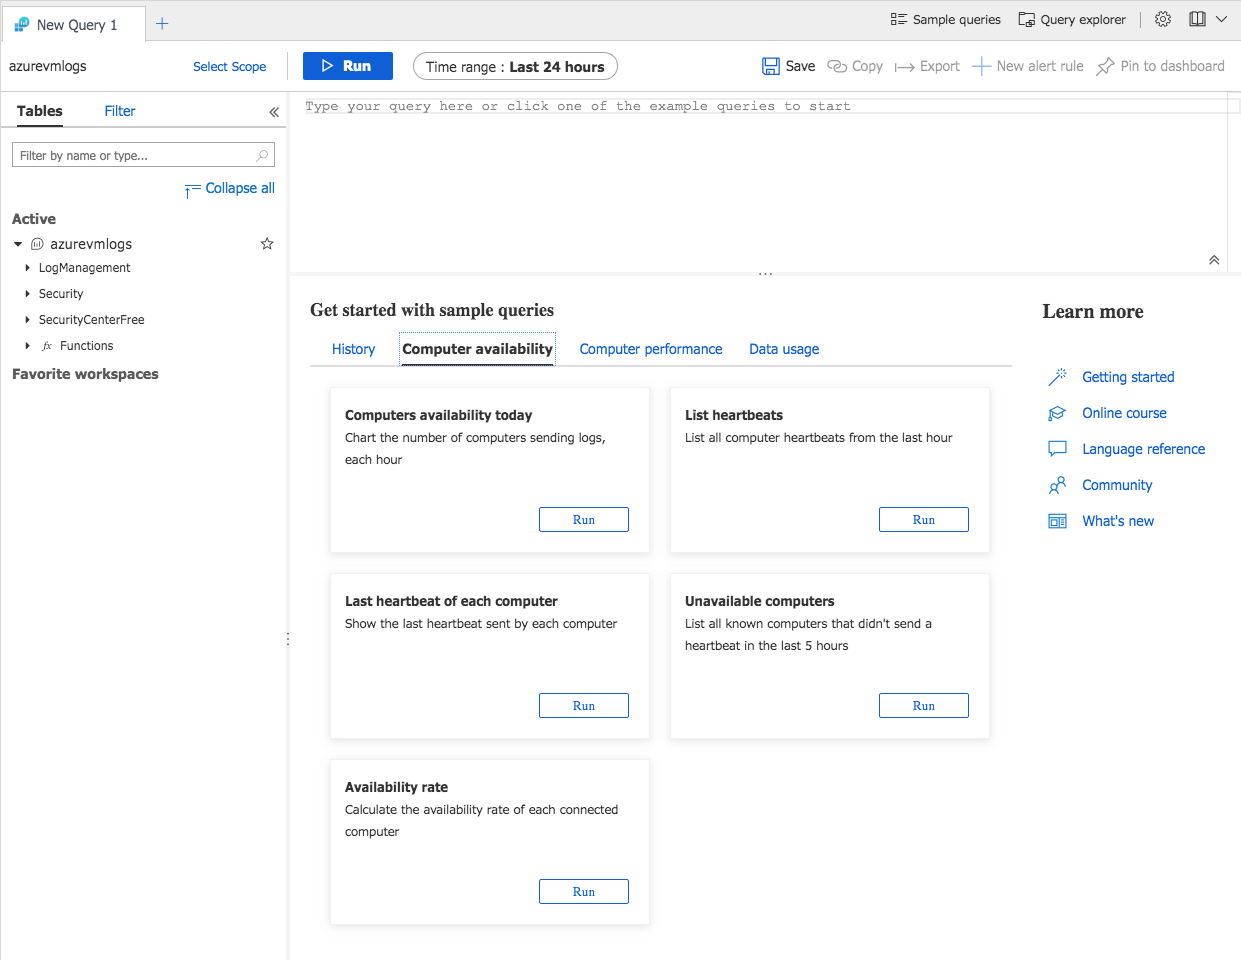
Once you have created a Log Analytics workspace in your Azure subscription you can access the data in your workspace by selecting the Logs link in the left navigation menu. This will give you direct access to the KQL Console for analyzing the collected data.
Note: If you just created this workspace it won’t contain any data
until we start adding data to it.
Collect Azure Activity Data
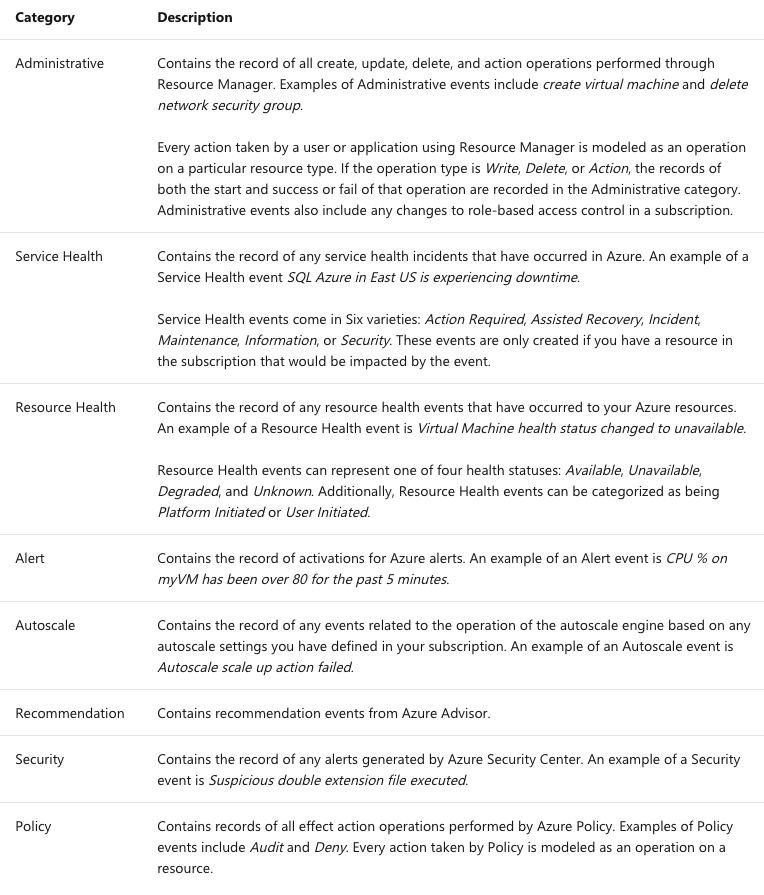
The first data we will start collecting in Log Analytics is the Azure
Activity Log. The Azure Activity Log is a subscription log that provides detail
about subscription level events. This includes Azure Resource Manager (ARM)
data, service health, service activity (ie. VM start and stops), etc. The
following table highlights the type of data that will be collected.
 .
.
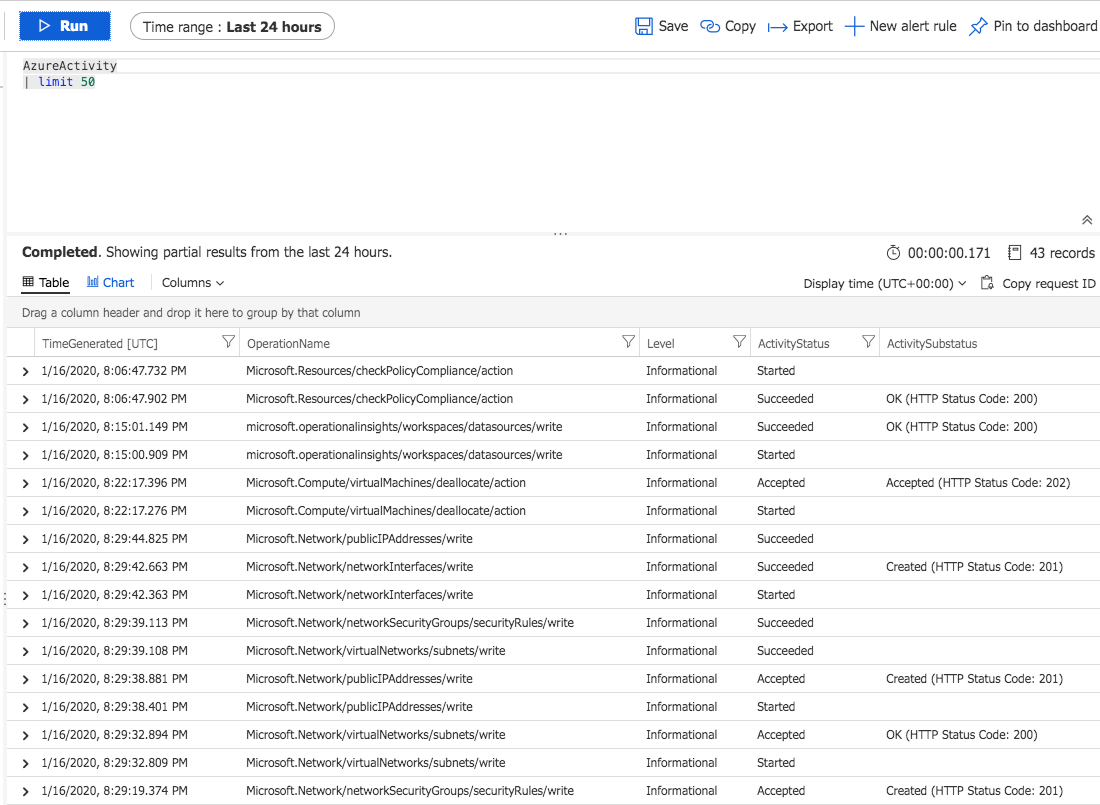
We can start the collection process by selecting the Azure Activity log option in the left menu of your Log Analytics workspace. Select the appropriate subscription you want to start collection on and choose the Connect option. That’s it. You are now streaming data into Log Analytics! If you perform some actions in the portal you should see data in Log Analytics. For instance if you create a new virtual machine or stop an existing virtual machine you will see data in the AzureActivity table
Try this in the Query Window under Logs. If you have performed any ARM actions you should now see some results from the query.
 .
.
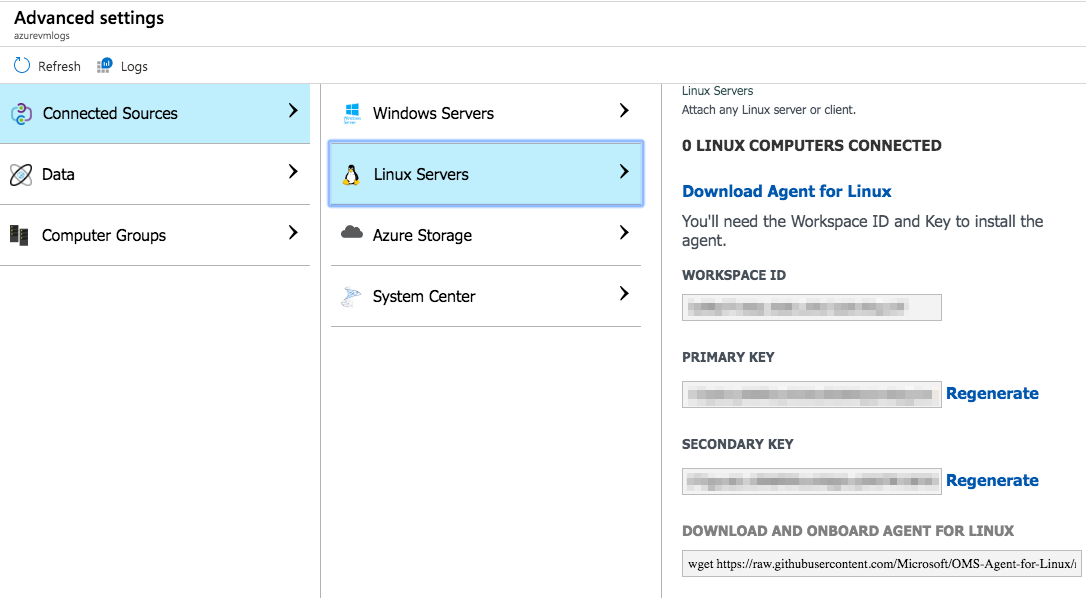
Now that we have some basic data in Log Analytics let’s add additional detail by connecting some Linux VMs to our workspace. There are several different ways to do this. You can navigate to your Log Analytics workspace and select Advanced settings. Here you will find options for connecting various data sources to the analytics workspace. If you select Connected Sources > Linux Servers you will find instructions on how to add the Linux agent to your servers and connect those agents to this workspace.
 .
.
If you prefer to sit back and direct work from a central location you have 2 options for installing the agent. The first option is via the Azure CLI.
az vm extension set \ 1 ↵ 10119 16:17:47
--resource-group your-vms-resource-group \
--vm-name your-vms-name \
--name OmsAgentForLinux \
--publisher Microsoft.EnterpriseCloud.Monitoring \
--version 1.10.1 --protected-settings '{"workspaceKey":"log-analytics-workspace-key-here"}' \
--settings '{"workspaceId":"log-analytics-workspace-id-here"}'
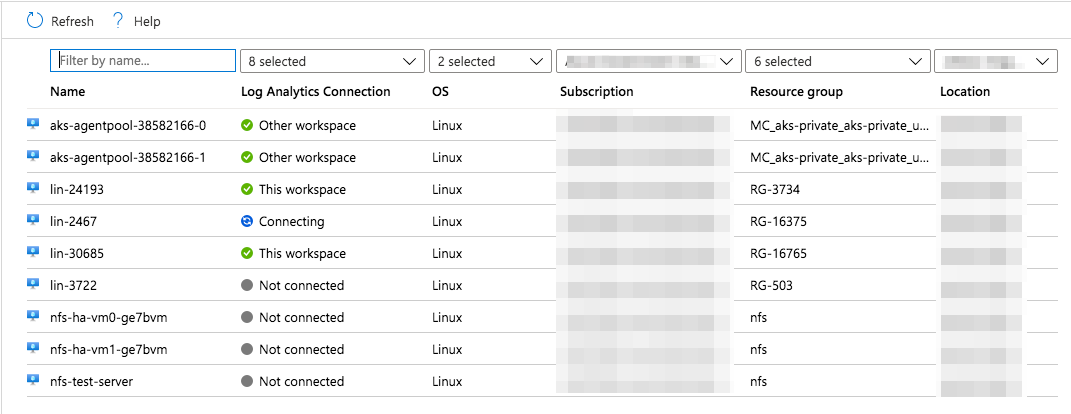
The other option is even easier. If you navigate to the Log Analytics workspace and select the Virtual machines option under Workspace Data Sources in the left navigation menu you’ll see all the VMs in the current subscription presented and whether they are connected to the workspace or not.
 .
.
From this screen you can select the VM you want to connect and then simply select Connect on the next screen. This will push the omsagent to the Linux machine and install it while also connecting it to the workspace.
Collect Syslog Data
So far we’ve created a Log Analytics workspace and also started capturing some basic information about Azure Activity in our workspace. But we want to go a step further and start loading Syslog data into Log Analytics so we have a central repository for Linux logs as well as a convenient way to issue queries against those logs and send alerts when anomolous behavior occurs.
The nice thing about the omsagent is that it is already configured to push Syslog to Log Analytics it’s just needs to be told which syslog facilities you want to send. If we look at /etc/rsyslog.d/95-omsagent.conf on any of the VMs we configured with the agent you’ll see an empty file.
>> cat /etc/rsyslog.d/95-omsagent.conf
# OMS Syslog collection for workspace 123456-xzxzx-5b5b-a35d-2a2byummy47
Again we have options for supplying values to this file. We can either push configuration to this file from the Log Analytics workspace or we can configure the file locally. In this particular case I’m going to push the configuration from the UI. The nice thing about using this option is that the configuration will be pushed to all the agents connected to this workspace without you having to configure each vm individually.
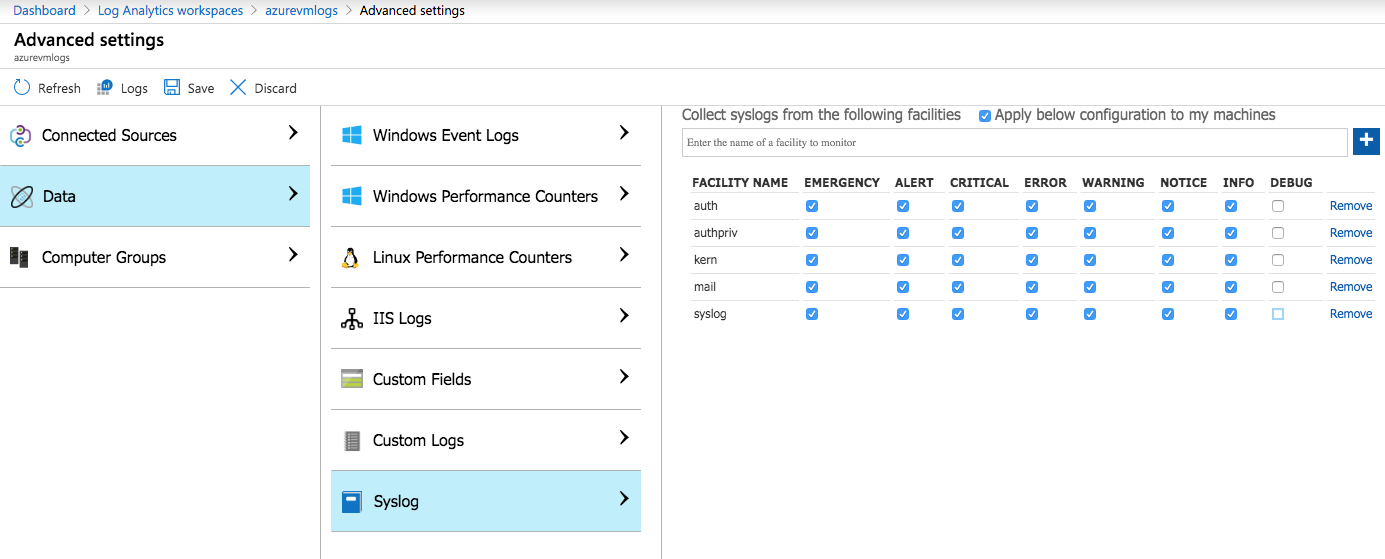
If you navigate to your Log Analytics workspace and select Advanced settings in the left navigation you’ll be back at the screen we viewed previously for information on how to configure the Linux agents manually. If we select the Data option this time you’ll have several data sources available to choose from for collecting data.
 .
.
To push the configuration to your connected Linux agents you will need to enter the name of the syslog facilities you want to capture and select the Apply below configuration to my machines option at the top of the page. Note: Don’t forget to select Save once you are done. Once you’ve saved your configuration you’ll need to wait a few minutes (usually 5-10 minutes is a safe bet) for the omsagent to pick up the new configuration and then your Linux logs will start being pushed to Log Analytics.
After the configuration defined in the portal is picked up by the omsagent you’ll now have values defined in your /etc/rsyslog.d/95-omsagent.conf file.
>> cat /etc/rsyslog.d/95-omsagent.conf
# OMS Syslog collection for workspace 3cf08a73-b0de-4b4b-a35d-2a2b183aa147
auth.=alert;auth.=crit;auth.=emerg;auth.=err;auth.=info;auth.=notice;auth.=warning	@127.0.0.1:25225
authpriv.=alert;authpriv.=crit;authpriv.=emerg;authpriv.=err;authpriv.=info;authpriv.=notice;authpriv.=warning	@127.0.0.1:25225
kern.=alert;kern.=crit;kern.=emerg;kern.=err;kern.=info;kern.=notice;kern.=warning	@127.0.0.1:25225
syslog.=alert;syslog.=crit;syslog.=emerg;syslog.=err;syslog.=info;syslog.=notice;syslog.=warning	@127.0.0.1:25225
Query Syslog
Now that we have our Syslog in Log Analytics we can setup alerts on those logs so that we can detect anomalous behavior. Let’s start with a query that looks for odd login behavior. Using KQL this query will look for “alert” and “crit” messages and also any “notice” level messages that have FAILED in the SyslogMessage field.
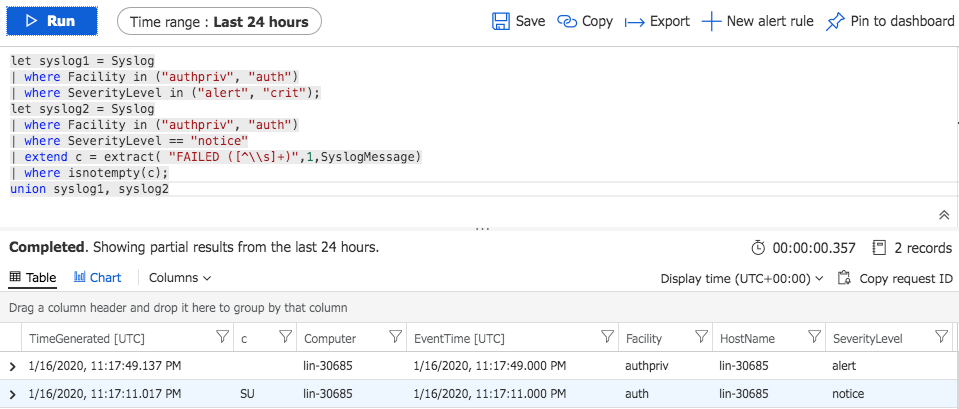
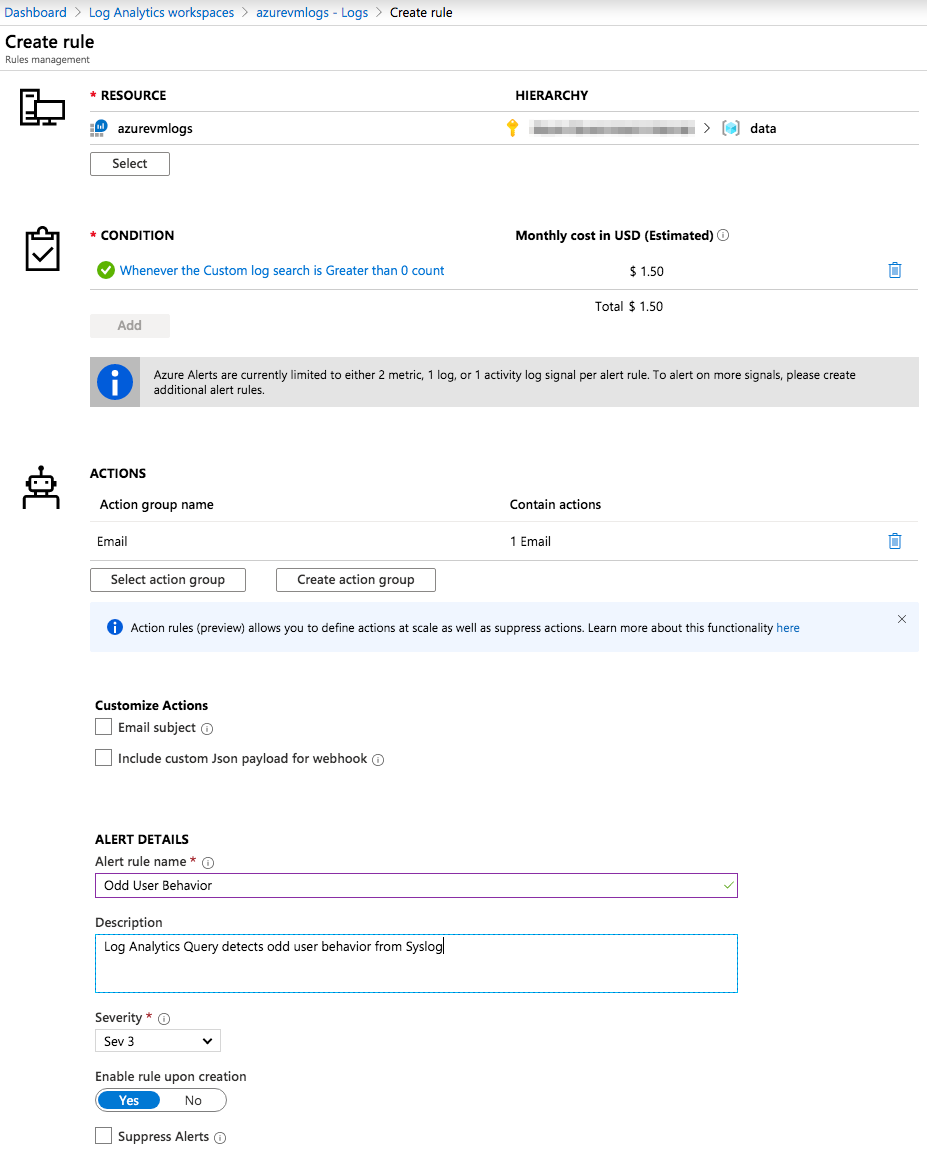
And that’s it! We now are seeing any odd login behavior being reported to Syslog from our Linux VMs. But let’s assume we don’t want to run this query manually in order to determine if we have problematic behavior going on. We can setup a Alert using this query so that whenever Syslog messages are consumed by Log Analytics if it detects any returned values for this query we can send an alert. By selecting New alert rule at the top of the results page we can setup a rule for this query.
 .
.
Now all we have to do is fill in the information for the alert and we will have automatic detection and alerts for any unusual user behavior that matches the query we just executed and this will continue to run as Syslog logs are ingested into Log Analytics.
Conclusion
So hopefully this was helpful and you see just how easy it is for Log Analytics to ingest Syslog files from VMs in your Azure subscription and detect anomalous behavior.